Transfer GPA by Major for Every UC
The University of California has finally made public the average GPA by major for admitted transfers at all nine UCs. This is a huge boon for all applicants who want to gauge their chances of getting into a UC by major. Up until now, we had to rely solely on UCLA’s average GPAs by major, as it was the only campus to publish them.
Using this guide will allow you to see how competitive you are in terms of other applicants to your major. It will also let you know if you should switch to a different major with a lower admitted GPA to optimize your chances. As you will see as you work through this, admitted GPAs fluctuate wildly, depending on the major chosen.
The new interactive page (http://www.universityofcalifornia.edu/infocenter/transfers-major) also allows you to track newly admitted transfers to every major by way of your chosen CA community college.
To give a brief rundown on how this new and EXCITING tool works:
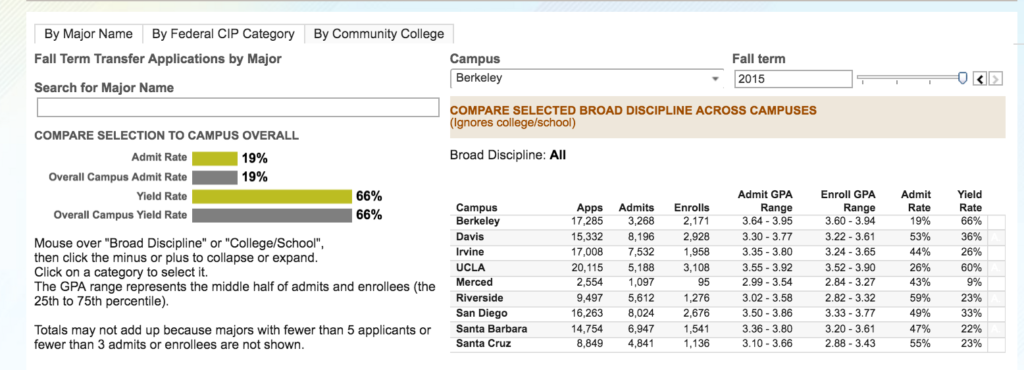
At the very top, the Broad Discipline on the right shows the statistics for that subject area at each UC. This includes multiple colleges or schools, as applicable. (You can change which broad discipline is chosen by clicking the individual discipline directly under this top heading.) Right now, it is defaulting to campus-wide.

Directly below this heading area are three categories:
- Broad Discipline (draws overall stats from multiple colleges)
- College or school (includes every major in each college)
- Designated major (the stats for a single major)
Let’s choose Berkeley, 2015 term, and Engineering as an example.
Click on the broad discipline Engineering to highlight it. The stats on the page will change. The yellow band at the top left of the page will show the admit (10%) and yield rate (82%) for the Engineering broad discipline vs admits to Berkeley overall. It also compares the Engineering discipline stats for every UC.

Now, looking to the right you will see there are three colleges in the Engineering broad discipline:
- College of Chemistry (with 3 majors)
- College of Engineering (with 6 majors)
- College of Letters and Science (with 1 major)
Clicking on College of Chemistry changes the top panel admit and yield rates.

Additionally, highlighting the College of Chemistry shows there were 257 applicants.

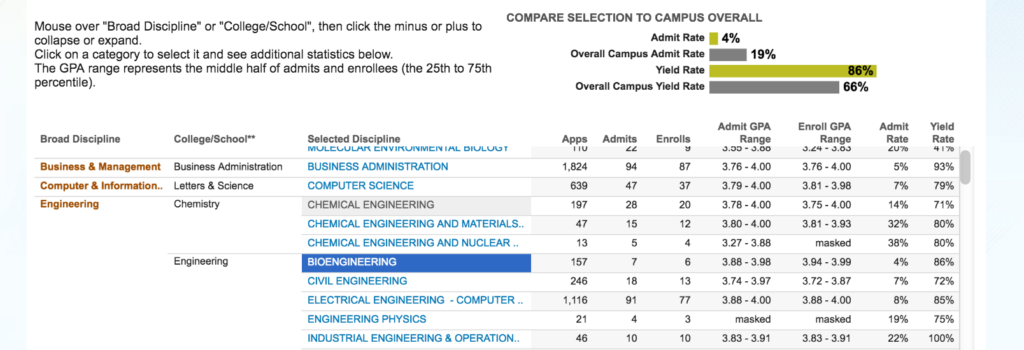
Now, moving back to Engineering, to the right, look at the Bioengineering major. You will see:

- There were 157 applications, and of those, 7 were admitted.
- Of those 7 admitted, 6 enrolled.
- The GPA mid-range of those offered admission was 3.88 – 3.98.
This range represents the middle 50% who those admitted. The lower number is the 25th percentile, meaning 25% had lower GPAs than 3.88 and the 75th percentile means 25% had a higher GPA than 3.98. For all intents and purposes, the average GPA is essentially the number in the middle of the 25-75 % range (around 3.93). - The admit rate was 4%. (7 admitted out of 157 applicants)
- The yield was 86%. (6 out of 7 offered admission actually enrolled)
View data by Community College
If you wish to view transfer stats by various community colleges, go back up to the top and simply change the page view. You can then pick a single year or multiple years to compare.
So that’s it. All in all this is a GREAT tool — one of the best the UCs have brought out in years. You should now easily be able to work your way through every UC and see the admit stats for every major.
Again, here’s the Transfer by Majors link . Have FUN!
photo credit and source: UC Information Center Data Warehouse


Comments (0)